Professionals in all areas – business; government; the physical, life, and social sciences; engineering; medicine, etc. – benefit from using statistical experimental design to better understand their worlds and then use that understanding to improve the products, processes, and programs they are responsible for. This book aims to provide the practitioners of tomorrow with a memorable, easy to read, engaging guide to statistics and experimental design.
This book uses examples, drawn from a variety of established texts, and embeds them in a business or scientific context, seasoned with a dash of humor, to emphasize the issues and ideas that led to the experiment and the what-do-we-do-next? steps after the experiment. Graphical data displays are emphasized as means of discovery and communication and formulas are minimized, with a focus on interpreting the results that software produce. The role of subject-matter knowledge, and passion, is also illustrated. The examples do not require specialized knowledge, and the lessons they contain are transferrable to other contexts.
Fundamentals of Statistical Experimental Design and Analysis introduces the basic elements of an experimental design, and the basic concepts underlying statistical analyses. Subsequent chapters address the following families of experimental designs:
Completely Randomized designs, with single or multiple treatment factors, quantitative or qualitative
Randomized Block designs
Latin Square designs
Split-Unit designs
Repeated Measures designs
Robust designs
Optimal designs
Written in an accessible, student-friendly style, this book is suitable for a general audience and particularly for those professionals seeking to improve and apply their understanding of experimental design.
Trusted by 375,005 students
Access to over 1.5 million titles for a fair monthly price.
Statistics is “learning from data.” We do statistics when we compare prices and specifications and perhaps Consumer Reports data in choosing a new cell phone, and we do it when we conduct large-scale experiments pertaining to medications and treatments for debilitating diseases.
Much of the way we learn from data is observational. We collect data on people, products, and processes to learn how they work. We look for relationships between variables that may provide clues on how to affect and improve those processes. Early studies on the association between smoking and various health problems are examples of the observational process—well organized and well executed.
The late Professor George Box (Box, Leonard, and Wu 1983; Box 2006; and in various conference presentations in the 1980s) depicted history as a series of events, some interesting, most mundane. Progress happens when there is an intelligent observer present who sees the interesting event and reacts—who capitalizes on what has been learned. Box cited the second fermentation of grapes, which produces champagne, as an especially serendipitous observation. (Legend has it that a French monk, Dom Pérignon, made the discovery: “Come quickly, I’m drinking the stars!” (Wikipedia 2015).)
Now clearly, as Professor Box argued, progress is speeded when interesting events happen more frequently and when there are more intelligent observers present at the event—“more” in the senses of both a greater number of intelligent observers and observers who are more intelligent. Experimentation—active, controlled intervention in a process, changing inputs and features of the process to see what happens to the outcome (rather than waiting for nature to act and be caught in the act)—by people with insight and knowledge offers the opportunity and means to learn from data with greater quickness and depth than would otherwise be the case. For example, by observation our ancestors learned that friction between certain materials could cause fire. By experimentation, and engineering, their descendants learned to make fire starting fast, reliable, and cheap—a mere flick of the Bic®. Active experimentation is now very much a part of business, science, engineering, education, government, and medicine. That role should grow.
For experimentation to be successful, experimental plans (“designs”) must be well conceived and faithfully executed. They must be capable of answering the questions that drive the research. Experimental designs need to be effective and efficient. Next, the experiment’s data need to be summarized and interpreted in a straightforward, informative way. The implications of the experiment’s results need to be clearly communicated. At the same time, limitations of what is learned need to be honestly acknowledged and clearly explained. Experiments yield limited, not infinite, data, and so conclusions need to be tempered by this fact. That’s what statistics is all about. This chapter provides an overview of the experimental design and statistical data analysis process, and the subsequent chapters do the details.
Steps in an Experimental Program
Planning and analysis
Learning from data: To do this successfully, data must first contain information. The purpose of experimental design is to maximize, for a given amount of resources, the chance that information-laden data will be generated and structured in such a way as to be conducive to extracting and communicating that information. More simply, we need data with a message, and we need that message to be apparent.
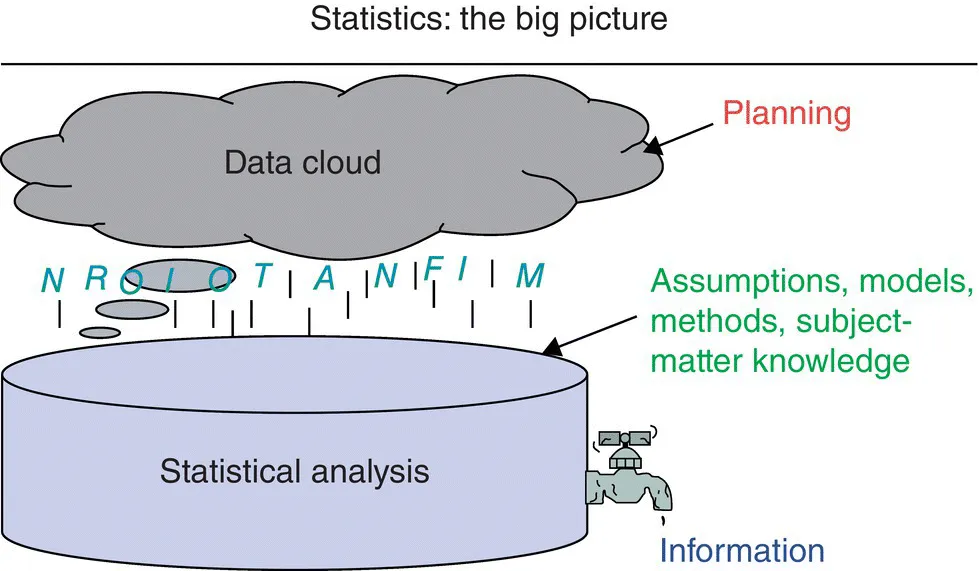
Figure 1.1 is a cartoon view of this process. There is a data cloud, from which information is precipitating. But this information may be fuzzy, indistinct, disorganized, and incomplete. The purpose of statistical analysis is to collect that information and distill it into clear, well-organized INFORMATION. But this process does not work on its own. Intervention is needed. First, if we do some cloud seeding at the start—planning studies and designing experiments—we should increase the amount and quality of precipitating information, and we should facilitate the distillation process. That is, with good planning, it should take less work to extract information from the data. Further, the distillation process needs catalysts—subject-matter knowledge, models, assumptions, and statistical methods. The aim of this text is to provide plans and analysis methods for turning ideas into experiments which yield data that yield information that translates into knowledge and actions based on our improved state of knowledge.
Figure 1.1 Statistics Schematic.
Good experimentation starts with subject-matter knowledge and passion—a strong desire to better understand natural and created phenomena. From this passion flow questions to be answered, questions that can best be posed from a foundation of subject-matter understanding. Statistics provides the tools and framework (i) for translating these questions into experiments and (ii) for interpreting the resulting data. We need to run experiments that are efficient and that are capable of answering questions; we need statistical methods to discover and characterize relationships in the experimental data and to answer whether apparent relationships are real or could easily be random. We need subject-matter knowledge and context to interpret and act on the relationships that are found in the experiments. Subject-matter knowledge and statistical methods need to be intertwined to be most effective in conducting experiments and learning from the resulting data.
Communication
Learning has to be communicated. As mentioned in the Preface, Archie Bunker, of the All in the Family TV show (check your cable TV listings for reruns), once told his son-in-law (approximately, and with typical inadvertent profundity), “Don’t give me no stastistics (sic), Meathead! I want facts!” What he meant was: talk to me in terms of the subject-matter, not in statistical jargon.
Statistics is inherently collaborative—a team sport. Successful experiments require subject-matter knowledge and passion and the statistical tools to translate that knowledge and passion into useful information. Statisticians tend to be passionate about the methods they can use to extract information from data. That’s what they want to talk about. For the collaborative professional in another field, those methods are only a means to an end: revealing and understanding new facts pertinent to his or her area of interest/passion. The experiment and resulting data advance understanding in that field, so it is essential, as Archie said, that statistical results be communicated in this context, not as “statistics” per se.
Subject-Matter Passion
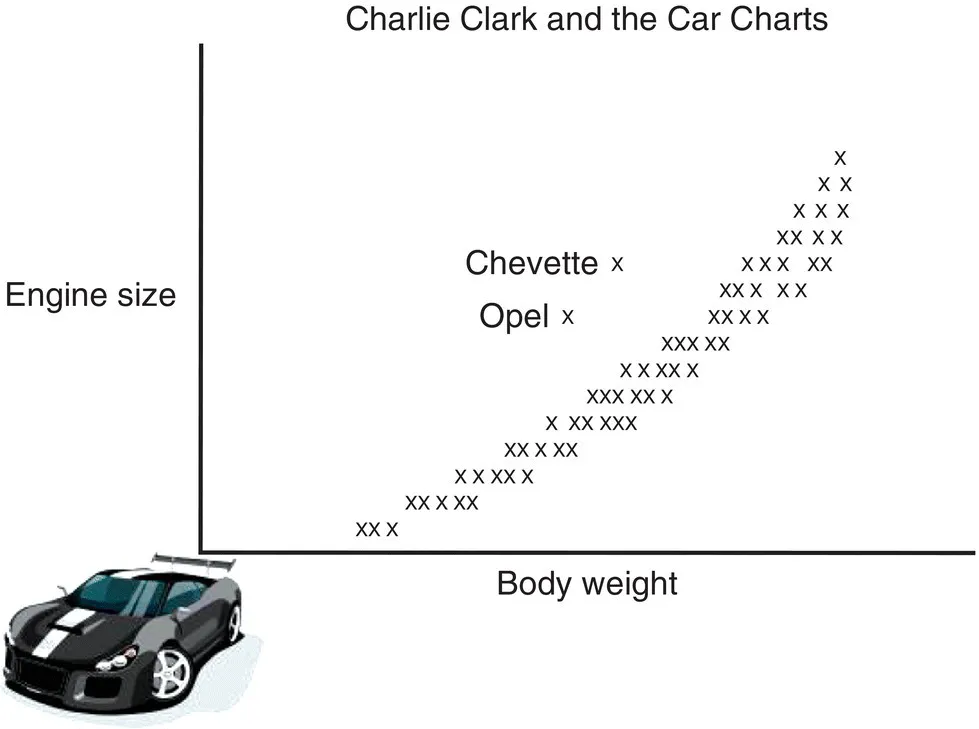
An example that shows the importance of bringing subject-matter passion to the appreciation and interpretation of data is a case study I call “Charlie Clark and the Car Charts.” The statistics group I managed at Sandia National Laboratories in Albuquerque had a small library, and when we got a new addition, I would route it around to the group so they would be aware of it. One new book I routed dealt with graphical methods. Charlie Clark was both thorough and a car nut. He did more than skim the table of contents—he read the book. One chart he came across was a scatter plot of automobile engine displacement versus body weight. This plot (approximately reproduced in Fig. 1.2) showed a slightly curved positive association—heavier cars have larger engines—and a couple of outlying points. The authors made the statistical points that you could not “see” the relationship between body size and engine size, or the outliers in a table of the data, whereas a plot shows these clearly. Then they commented that the outliers might be unusual cars or mistakes in the data and went on to other topics.
Figure 1.2 Car Data: Engine Size ...
Table of contents
Cover
Title Page
Table of Contents
Preface
Acknowledgments
Credits
1 Introduction
2 Fundamentals of Experimental Design
3 Fundamentals of Statistical Data Analysis
4 Completely Randomized Design
5 Completely Randomized Design with Multiple Treatment Factors
6 Randomized Complete Block Design
7 Other Experimental Designs
Index
End User License Agreement
Frequently asked questions
Yes, you can cancel anytime from the Subscription tab in your account settings on the Perlego website. Your subscription will stay active until the end of your current billing period. Learn how to cancel your subscription
No, books cannot be downloaded as external files, such as PDFs, for use outside of Perlego. However, you can download books within the Perlego app for offline reading on mobile or tablet. Learn how to download books offline
Perlego offers two plans: Essential and Complete
Essential is ideal for learners and professionals who enjoy exploring a wide range of subjects. Access the Essential Library with 800,000+ trusted titles and best-sellers across business, personal growth, and the humanities. Includes unlimited reading time and Standard Read Aloud voice.
Complete: Perfect for advanced learners and researchers needing full, unrestricted access. Unlock 1.5M+ books across hundreds of subjects, including academic and specialized titles. The Complete Plan also includes advanced features like Premium Read Aloud and Research Assistant.
Both plans are available with monthly, semester, or annual billing cycles.
We are an online textbook subscription service, where you can get access to an entire online library for less than the price of a single book per month. With over 1.5 million books across 990+ topics, we’ve got you covered! Learn about our mission
Look out for the read-aloud symbol on your next book to see if you can listen to it. The read-aloud tool reads text aloud for you, highlighting the text as it is being read. You can pause it, speed it up and slow it down. Learn more about Read Aloud
Yes! You can use the Perlego app on both iOS and Android devices to read anytime, anywhere — even offline. Perfect for commutes or when you’re on the go. Please note we cannot support devices running on iOS 13 and Android 7 or earlier. Learn more about using the app
Yes, you can access Fundamentals of Statistical Experimental Design and Analysis by Robert G. Easterling in PDF and/or ePUB format, as well as other popular books in Mathematics & Probability & Statistics. We have over 1.5 million books available in our catalogue for you to explore.