eBook - ePub
Multiple-point Geostatistics
Stochastic Modeling with Training Images
- English
- ePUB (mobile friendly)
- Available on iOS & Android
eBook - ePub
Multiple-point Geostatistics
Stochastic Modeling with Training Images
About this book
This book provides a comprehensive introduction to multiple-point geostatistics, where spatial continuity is described using training images. Multiple-point geostatistics aims at bridging the gap between physical modelling/realism and spatio-temporal stochastic modelling. The book provides an overview of this new field in three parts. Part I presents a conceptual comparison between traditional random function theory and stochastic modelling based on training images, where random function theory is not always used. Part II covers in detail various algorithms and methodologies starting from basic building blocks in statistical science and computer science. Concepts such as non-stationary and multi-variate modeling, consistency between data and model, the construction of training images and inverse modelling are treated. Part III covers three example application areas, namely, reservoir modelling, mineral resources modelling and climate model downscaling. This book will be an invaluable reference for students, researchers and practitioners of all areas of the Earth Sciences where forecasting based on spatio-temporal data is performed.
Tools to learn more effectively

Saving Books

Keyword Search

Annotating Text

Listen to it instead
Information
PART I
Concepts
CHAPTER 1
Hiking in the Sierra Nevada
1.1 An imaginary outdoor adventure company: Buena Sierra
As is the case for any applied science, no geostatistical application is without context. This context matters; it determines modeling choices, parameter choices, and the level of detail required in such modeling. In this short first chapter, we introduce an imagined context that has elements common to many applications of geostatistics: sparse local data, indirect (secondary) or trend information, a transfer function or decision variable, as well as a specific study target. The idea of doing so is to remain general by employing a synthetic example whose elements can be linked or translated into one's own area of application.
Consider an imaginary hiking company, Buena Sierra, a start-up company interested in organizing hiking adventures in the Sierra Nevada Mountains in the area shown in Figure I.1.1(left). The company drops customers over a range of locations to hike over a famous but challenging mountain range and meets them at the other end of that range for pickup. Customers require sufficient supplies in what is considered a strenuous trip over rocky terrain, with high elevation changes on possibly hot summer days. Imagine, however, that this area lies in the vicinity of a military base; hence, no detailed topographic or digital elevation model from satellite observation is available at this point. Instead, the company must rely on sparse point information obtained from weather stations in the area, dotted over the landscape; see Figure I.1.1(right). We consider that the exact elevation of these weather stations has been determined. The company now needs to plan for the adventure trip. This would require determining the quantity of supplies needed for each customer, which would require knowing the length of the path and the cumulative elevation gain because both correlate well with effort. The hike will generally move from west to east. The starting location can be any location on the west side from grid cell (100,1) to grid cell (180,1) (see Figure I.1.2).
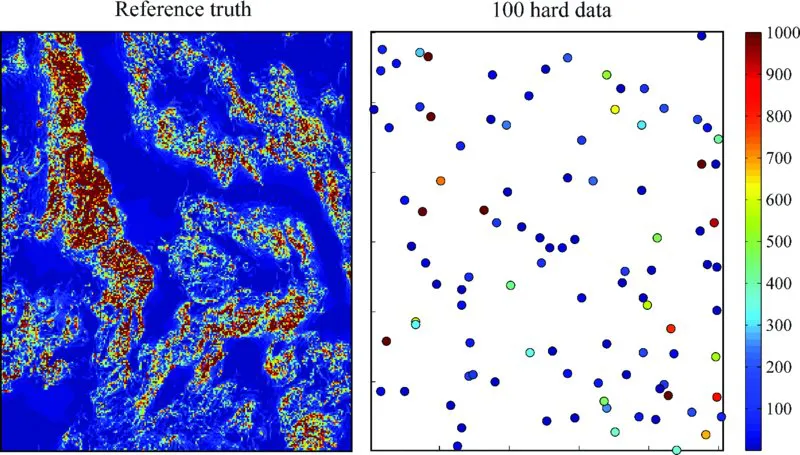
Figure I.1.1 (left) Walker Lake exhaustive digital elevation map (size: 260×300 pixels) grid; and (right) 100 extracted sample data. The colorbar represents elevation in units of ft.
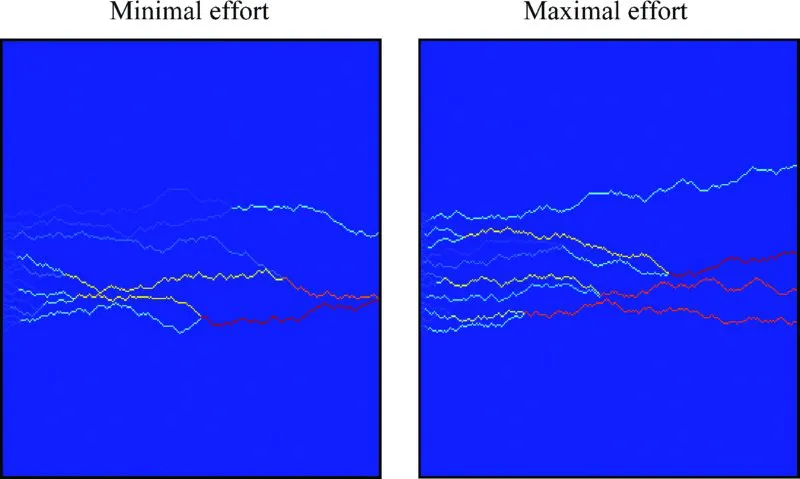
Figure I.1.2 Visualization of the 80 paths taken by hikers of two types: (left) minimal effort; and (right) maximal effort. The color indicates how frequently that portion of the path is taken, with redder color denoting higher frequency.
To make predictions about path length and cumulative elevation gain, a small routing computer program is written; although it simplifies real hiking, the program is considered adequate for this situation. More advanced routing could be applied, but this will not change the intended message of this imaginary example. The program requires as input a digital elevation map (DEM) of the area gridded on a certain grid. The program has as input a certain point on the west side, then walks by scanning for the direction that has the smallest elevation change. The program simulates two types of hikers: the minimal-effort (lazy) hiker and the maximal-effort (achiever) hiker. In both cases, the program assumes the hiker thinks only locally, namely, follows a path that is based on where they are and what lies just ahead. The minimal hiker takes a path of local least resistance (steepest downhill or least uphill). The achiever hiker takes a path of maximal ascent (or minimal descent). Note that the computer program represents a deterministic transfer function: given a single DEM map, a single starting point, and a specific hiker type, it outputs a single deterministic hiking route. If the actual reference, Walker Lake, is used as input, then given starting locations from grid cell (100,1) to (180,1) on the west side, a total of 80 outcomes are generated. These 80 outcomes can be shown as a histogram; see Figure I.1.3. The resulting path statistics for both minimal ...
Table of contents
- Cover
- Title Page
- Copyright
- Preface
- Acknowledgments
- Part I: Concepts
- Part II: Methods
- Part III: Applications
- Index
- End User License Agreement
Frequently asked questions
Yes, you can cancel anytime from the Subscription tab in your account settings on the Perlego website. Your subscription will stay active until the end of your current billing period. Learn how to cancel your subscription
No, books cannot be downloaded as external files, such as PDFs, for use outside of Perlego. However, you can download books within the Perlego app for offline reading on mobile or tablet. Learn how to download books offline
Perlego offers two plans: Essential and Complete
- Essential is ideal for learners and professionals who enjoy exploring a wide range of subjects. Access the Essential Library with 800,000+ trusted titles and best-sellers across business, personal growth, and the humanities. Includes unlimited reading time and Standard Read Aloud voice.
- Complete: Perfect for advanced learners and researchers needing full, unrestricted access. Unlock 1.4M+ books across hundreds of subjects, including academic and specialized titles. The Complete Plan also includes advanced features like Premium Read Aloud and Research Assistant.
We are an online textbook subscription service, where you can get access to an entire online library for less than the price of a single book per month. With over 1 million books across 990+ topics, we’ve got you covered! Learn about our mission
Look out for the read-aloud symbol on your next book to see if you can listen to it. The read-aloud tool reads text aloud for you, highlighting the text as it is being read. You can pause it, speed it up and slow it down. Learn more about Read Aloud
Yes! You can use the Perlego app on both iOS and Android devices to read anytime, anywhere — even offline. Perfect for commutes or when you’re on the go.
Please note we cannot support devices running on iOS 13 and Android 7 or earlier. Learn more about using the app
Please note we cannot support devices running on iOS 13 and Android 7 or earlier. Learn more about using the app
Yes, you can access Multiple-point Geostatistics by Professor Gregoire Mariethoz,Jef Caers in PDF and/or ePUB format, as well as other popular books in Physical Sciences & Geology & Earth Sciences. We have over one million books available in our catalogue for you to explore.