Ed Ponsi's straightforward guide to understanding technical analysis
Technical Analysis and Chart Interpretations delivers simple explanations and easy-to-understand techniques that demystify the technical analysis process. In his usual straightforward style, bestselling author Ed Ponsi guides you through the twists and turns to show you what really matters when it comes to making money. Whether you trade stocks, currencies, or commodities, you'll develop invaluable skills as you master difficult concepts and the tools of the trade. Technical analysis translates to any form of trading, and this book delivers clear, jargon-free guidance toward interpreting the various charts you'll see in the field.
Technical analysis can be confusing. Volatility, cycles, Elliot waves, Fibonacci, trends—it's easy to get lost, and most of the available literature is incomprehensible to all but the experts. This book is different—it's technical analysis for the rest of us. You'll see through the language to understand the underlying concepts, and how to apply them correctly.
Learn what true technical analysis entails
Discover the tools that simplify accurate analysis
Master the tactics and strategies used by the pros
Develop a valuable trading skill that transcends markets
Simply recognizing the vocabulary isn't nearly enough, and a passing acquaintance with the topic is guaranteed to do more harm than good. When technical analysis methods are used incorrectly, they are ineffective at best, and actively destructive to your bottom line at worst. Technical Analysis and Chart Interpretations cuts through the confusion to give you a firm understanding and the skills to apply it correctly.
Trusted by 375,005 students
Access to over 1.5 million titles for a fair monthly price.
Why would anyone want to learn about technical analysis? If we want to understand how to analyze stocks, shouldn't we concern ourselves with valuation metrics like EBITDA (earnings before interest, taxes, depreciation, and amortization) and price-to-sales ratios? Wouldn't our time be better spent listening to conference calls and digging through balance sheets instead of poring over charts in search of various patterns and formations?
In truth, there is nothing wrong with doing any of the above. Terms such as price-to-sales ratio and EBITDA fall under the auspices of “fundamental analysis.” Fundamental analysis can be a useful tool for analyzing investment opportunities. Think of technical and fundamental analysis as two different sides of the same coin.
However, fundamental analysis isn't foolproof. You can learn every nuance of fundamental analysis and include every major and minor fundamental metric in your analysis, but you'll still face this problem: You'll never know what you don't know. You can analyze all of the information that is available to you, but you'll never know if you possess all of the necessary information.
Meanwhile, somebody out there usually does know something that you or I don't know. An investment bank that hires an army of MBAs to crunch numbers and pours millions into research should know more than the average individual. The market is not a level playing field, and this is particularly true when it comes to fundamental analysis.
Meanwhile, technical analysts believe that all of the necessary information, including data that may be unknown to the public, is reflected in the chart. The price of a trading instrument should reflect all that is known or knowable about that stock, commodity, or currency.
All of the information is included in the price, even inside information. We don't have to know or understand the information to observe its effect on the price.
How can this be possible?
Let's say that a mutual fund or an investment bank has discovered through its research that stock ABC is wildly undervalued and is a screaming buy. The bank starts buying the stock aggressively.
You might never know what it is they know, or who is buying the stock, but if you look at ABC's chart, you should see the effect of that buying in the form of a rising price. That rising price is trying to tell you something, even if you don't know the reason behind the move. It's not necessary to know who or what is behind every move in the market.
Technical and Fundamental Divergence
Fundamentally, a stock or a currency may appear to be pristine, but if the chart tells a different story, believe the chart. There have been many instances where technical analysis and fundamental analysis told very different stories. On several occasions, this divergence has led to a dramatic conclusion.
For example, back in 2001 a major energy stock began to break down for no apparent reason. Most analysts gave this $60 billion company a “strong buy” or “buy” rating. For six consecutive years, Fortune magazine declared it to be “America's Most Innovative Company.” The stock had been one of the best performers in the energy sector, quadrupling in price in just three years.
When the stock's price began to slip, and technical support levels began to break, fundamental analysts showed little concern. As the price continued to fall, many fundamental analysts referred to the stock's depressed price as “a buying opportunity,” and initiated or reiterated buy ratings on the stock.
The name of that company was Enron. That infamous name is now synonymous with fraud and deceit.
The fundamental analysts who upgraded the stock as it fell believed they possessed all of the information needed to make an informed recommendation. What they didn't know is that the company had fed them false information. The information was worthless, and so was the stock!
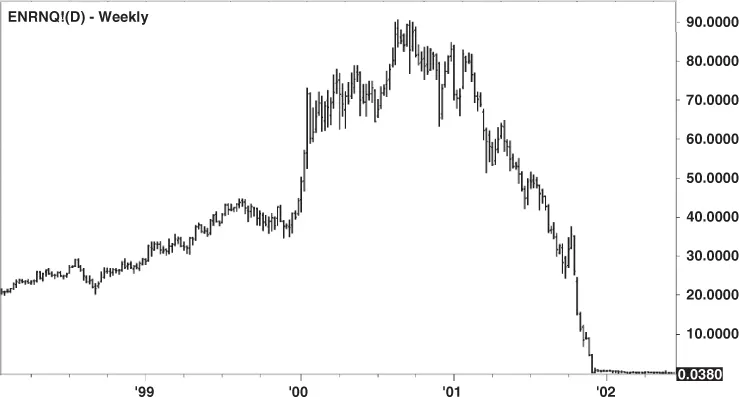
During the year 2000, Enron climbed above $84 per share; one year later, the stock had fallen below $1. As a result, lives were ruined, pensions became worthless, and future plans evaporated into thin air.
The fundamental analyst works under the assumption that he or she is receiving complete and accurate information, but there is no way to know for certain that this is true. However, one look at Enron's chart, shown in Figure 1.1, should have made it clear that something was horribly wrong with the stock. Yet during its decline, Enron executives repeatedly insisted that there were no irregularities. They even encouraged their employees to buy more shares, just before the stock completely collapsed!
Figure 1.1 The Rise and Fall of Enron
As the stock fell, it formed several bearish technical patterns. By the time you've completed this book, you'll know how to understand and apply those patterns should a similar situation arise in the future.
Enron is an extreme example, but it raises an important point: While the executives of the company were lying about the business, and while analysts were basing their assumptions about the company on those lies, the stock's price was telling the truth.
Those who knew the truth about Enron were selling their shares heavily. This is what caused the price to decline so dramatically—the truth was reflected in the stock's price. Any individual trader could have known that there was a problem by looking at the chart—and by ignoring the chorus of fundamental analysts and company officials who insisted Enron was a bargain as it fell.
The Collapse of Lehman Brothers
Another company that confounded analysts under a very different set of circumstances was an investment bank named Lehman Brothers Holdings. Unlike Enron, Lehman Brothers was a legitimate company with a rich history and real profits.
The investment banking company got its start in the 1850s, and by 1887 it was a member of the New York Stock Exchange. By the twenty-first century, it had grown into one of the most successful enterprises of its kind.
During 2007, shares of Lehman Brothers performed extremely well. That year, the stock reached an all-time peak, trading as high as $86.18. The company's shareholders were thrilled with the stock's performance.
Then a severe financial crisis swept the world in 2008, and the company was caught in the storm. The stock began a steep descent. There were persistent rumors that Lehman Brothers was on the verge of insolvency, which the company routinely denied.
During the summer of 2008, those rumors became more persistent, yet company officials never gave any indication to the public that the company was in trouble. The stock's decline accelerated. On September 9, 2008, the Standard & Poor's rating agency put Lehman Brothers on watch for a downgrade, citing its plunging stock price, but at the same time maintained an “A” rating on the stock.
Less than one week later, on September 15, 2008, Lehman Brothers declared bankruptcy. The stock was now virtually worthless. Later that day, Standard & Poor's removed its “A” rating from the stock.
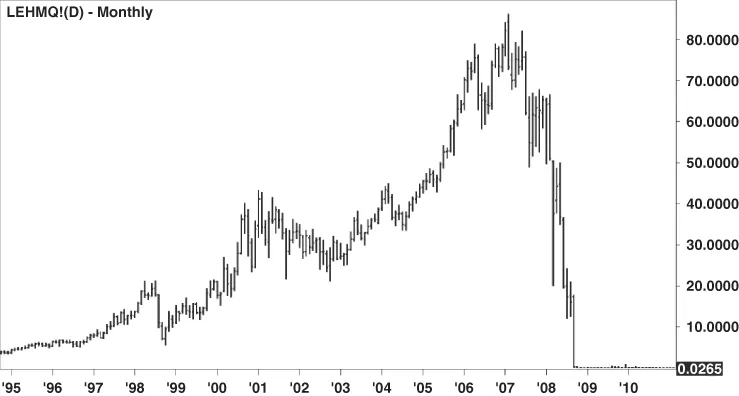
Figure 1.2 depicts the stock's rapid decline. Technical analysts will note that Lehman's chart formed an extremely ominous technical pattern just after the stock reached its all-time peak. This pattern warned technical traders to avoid the stock, even as investors who believed the company's management were buying additional shares.
Figure 1.2 The Rise and Fall of Lehman Brothers
Price Is Truth
If fundamental analysts like those at Standard & Poor's had simply focused on the stock's price, they would have noticed a distressed chart that was breaking at all of its major support levels. One glance at that chart proved to be worth much more than countless hours of so-called expert analysis and number crunching.
Think of all the misery that could have been avoided by simply paying attention to that chart. Just as with Enron, Lehman Brothers' employees were heavily invested in the company's stock, particularly in their re...
Table of contents
Cover
Title Page
Copyright
Table of Contents
Dedication
Introduction: The Journey
About the Author
Part I: The Foundation of Technical Analysis
Part II: Key Concepts of Technical Analysis
Part III: Price Patterns
Part IV: Candlestick Patterns
Part V: Fibonacci
Part VI: Technical Indicators
Part VII: Oscillators
Part VIII: ATR, ADX, and PSAR
Part IX: Cycles
Part X: Point and Figure Charting
Part XI: Odds and Ends
Part XII: Behavioral Aspects of Technical Analysis
Index
End User License Agreement
Frequently asked questions
Yes, you can cancel anytime from the Subscription tab in your account settings on the Perlego website. Your subscription will stay active until the end of your current billing period. Learn how to cancel your subscription
No, books cannot be downloaded as external files, such as PDFs, for use outside of Perlego. However, you can download books within the Perlego app for offline reading on mobile or tablet. Learn how to download books offline
Perlego offers two plans: Essential and Complete
Essential is ideal for learners and professionals who enjoy exploring a wide range of subjects. Access the Essential Library with 800,000+ trusted titles and best-sellers across business, personal growth, and the humanities. Includes unlimited reading time and Standard Read Aloud voice.
Complete: Perfect for advanced learners and researchers needing full, unrestricted access. Unlock 1.5M+ books across hundreds of subjects, including academic and specialized titles. The Complete Plan also includes advanced features like Premium Read Aloud and Research Assistant.
Both plans are available with monthly, semester, or annual billing cycles.
We are an online textbook subscription service, where you can get access to an entire online library for less than the price of a single book per month. With over 1.5 million books across 990+ topics, we’ve got you covered! Learn about our mission
Look out for the read-aloud symbol on your next book to see if you can listen to it. The read-aloud tool reads text aloud for you, highlighting the text as it is being read. You can pause it, speed it up and slow it down. Learn more about Read Aloud
Yes! You can use the Perlego app on both iOS and Android devices to read anytime, anywhere — even offline. Perfect for commutes or when you’re on the go. Please note we cannot support devices running on iOS 13 and Android 7 or earlier. Learn more about using the app
Yes, you can access Technical Analysis and Chart Interpretations by Ed Ponsi in PDF and/or ePUB format, as well as other popular books in Business & Trading. We have over 1.5 million books available in our catalogue for you to explore.