Time Series Data Analysis Using EViews
eBook - ePub

Time Series Data Analysis Using EViews

I. Gusti Ngurah Agung

Compartir libro
  1. English
  2. ePUB (apto para móviles)
  3. Disponible en iOS y Android
eBook - ePub

Time Series Data Analysis Using EViews

I. Gusti Ngurah Agung

Detalles del libro
Vista previa del libro
Índice
Citas

Información del libro

Do you want to recognize the most suitable models for analysis of statistical data sets?

This book provides a hands-on practical guide to using the most suitable models for analysis of statistical data sets using EViews - an interactive Windows-based computer software program for sophisticated data analysis, regression, and forecasting - to define and test statistical hypotheses. Rich in examples and with an emphasis on how to develop acceptable statistical models, Time Series Data Analysis Using EViews is a perfect complement to theoretical books presenting statistical or econometric models for time series data. The procedures introduced are easily extendible to cross-section data sets.

The author:

  • Provides step-by-step directions on how to apply EViews software to time series data analysis
  • Offers guidance on how to develop and evaluate alternative empirical models, permitting the most appropriate to be selected without the need for computational formulae
  • Examines a variety of times series models, including continuous growth, discontinuous growth, seemingly causal, regression, ARCH, and GARCH as well as a general form of nonlinear time series and nonparametric models
  • Gives over 250 illustrative examples and notes based on the author's own empirical findings, allowing the advantages and limitations of each model to be understood
  • Describes the theory behind the models in comprehensive appendices
  • Provides supplementary information and data sets

An essential tool for advanced undergraduate and graduate students taking finance or econometrics courses. Statistics, life sciences, and social science students, as well as applied researchers, will also find this book an invaluable resource.

Preguntas frecuentes

¿Cómo cancelo mi suscripción?
Simplemente, dirígete a la sección ajustes de la cuenta y haz clic en «Cancelar suscripción». Así de sencillo. Después de cancelar tu suscripción, esta permanecerá activa el tiempo restante que hayas pagado. Obtén más información aquí.
¿Cómo descargo los libros?
Por el momento, todos nuestros libros ePub adaptables a dispositivos móviles se pueden descargar a través de la aplicación. La mayor parte de nuestros PDF también se puede descargar y ya estamos trabajando para que el resto también sea descargable. Obtén más información aquí.
¿En qué se diferencian los planes de precios?
Ambos planes te permiten acceder por completo a la biblioteca y a todas las funciones de Perlego. Las únicas diferencias son el precio y el período de suscripción: con el plan anual ahorrarás en torno a un 30 % en comparación con 12 meses de un plan mensual.
¿Qué es Perlego?
Somos un servicio de suscripción de libros de texto en línea que te permite acceder a toda una biblioteca en línea por menos de lo que cuesta un libro al mes. Con más de un millón de libros sobre más de 1000 categorías, ¡tenemos todo lo que necesitas! Obtén más información aquí.
¿Perlego ofrece la función de texto a voz?
Busca el símbolo de lectura en voz alta en tu próximo libro para ver si puedes escucharlo. La herramienta de lectura en voz alta lee el texto en voz alta por ti, resaltando el texto a medida que se lee. Puedes pausarla, acelerarla y ralentizarla. Obtén más información aquí.
¿Es Time Series Data Analysis Using EViews un PDF/ePUB en línea?
Sí, puedes acceder a Time Series Data Analysis Using EViews de I. Gusti Ngurah Agung en formato PDF o ePUB, así como a otros libros populares de Mathematik y Wahrscheinlichkeitsrechnung & Statistiken. Tenemos más de un millón de libros disponibles en nuestro catálogo para que explores.

Información

Editorial
Wiley
Año
2011
ISBN
9781118176306
CHAPTER 1
EViews workfile and descriptive data analysis
1.1 What is the EViews workfile?
The EViews workfile is defined as a file in EViews, which provides many convenient visual ways, such as (i) to enter and save data sets, (ii) to create new series or variables from existing ones, (iii) to display and print series and (iv) to carry out and save results of statistical analysis, aswell as each equation of the models applied in the analysis. By using EViews, each statistical model that applied previously could be recalled and modified easily and quickly to obtain the best fit model, based on personal judgment using an interactive process. Corresponding to this process, the researcher could use a specific name for each EViews workfile, so that it can be identified easily for future utilization.
This chapterwill describe howto create aworkfile in a very simpleway by going through MicrosoftExcel, aswell as other package programs, ifEViews 5 or 6 are used. Furthermore, this chapter will present some illustrative statistical data analysis, mainly the descriptive analysis, which could also be considered as an exploration or an evaluation data analysis.
1.2 Basic options in Eviews
It is recognized that many students have been using EViews 4 and 5. For this reason, in this section the way to create a workfile using EViews 4 is also presented, as well as those using EViews 5 and 6. However, all statistical results presented as illustrative examples use EViews 6.
Figure 1.1 presents the toolbar of the EViews main menus. The first line is the Title Bar, the second line is the Main Menus and the last space is the CommandWindowand the Work Area.
Then all possible selections can be observed under each of the main menus. Two of the basic options are as follows:
(1) To create a workfile, click File/New, which will give the options in Figure 1.2.
Figure 1.1 The toolbar of the main menus
c01_figure001
Figure 1.2 The complete options of the new file in EViews 4, 5 and 6
c01_figure002
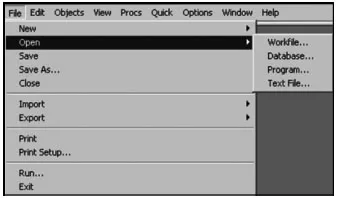
(2) To open aworkfile, click File/Open, which will give the options in Figure 1.3 using EViews 4. Using EViews 5 or 6 gives the options in Figure 1.4.
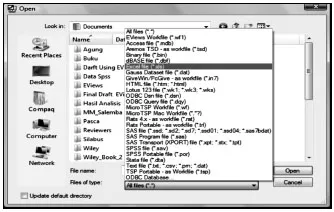
Note that by using EViews 5 or 6, ‘Foreign Data as Workfile….’ can be opened. By selecting the option ‘Foreign Data as Workfile…’ and clicking the.All files (*.*). option, all files presented in Figure 1.5 can be seen, and can be opened as workfiles. Then a workfile can be saved as an EViews workfile.
Figure 1.3 The complete options of the open file in EViews 4
c01_figure003
Figure 1.4 The complete options of the open file in EViews 5 and 6
c01_figure004
Figure 1.5 All files that can be opened as a workfile using EViews 5 and 6
c01_figure005
1.3 Creating a workfile
1.3.1 Creating a workfile using EViews 5 or 6
Since many ‘Foreign Data as Workfile…’ can be opened using EViews 5, as well as EViews 6, as presented in Figures 1.3 and 1.4, there are many alternative ways that can be used to create an EViews workfile. This makes it easy for a researcher to create or derive new variables, indicators, composite indexes as well as latent variables (unmeasurable or unobservable factors) by using any one of the package programs presented in Figure 1.4, which is very convenient for the researcher. Then he/she can open the whole data set as a workfile.
1.3.2 Creating a workfile using EViews 4
By assuming that creating an Excel datafile is not a problem for a researcher, only the steps required to copy Data.xls to an EViews workfile will be presented here. As an illustration and for the application of statistical data analysis, the data in Demo.xls will be used, which are already available in EViews 4.
To create the desired workfile, the steps are as follows:
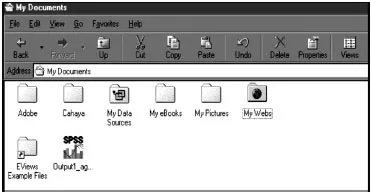
(1) If EViews 4 is correctly installed, by clicking My Documents…, the directory ‘EViews Example Files’ will be seen inMy Documents, as presented in Figure 1.6.
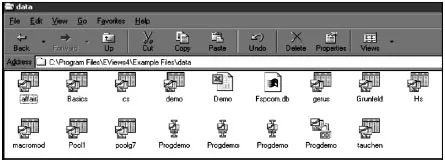
(2) Double click on the EViews Example Files, then double click on the data and the window in Figure 1.7 will appear. Then the file Demo.xls can be seen, in addition to several workfiles and programs. From now on, Demo.xls will be used.
(3) Double click on Demo.xls; a time series data set having four variables will be seen: GDP, PR, NPM and RS in an Excel spreadsheet, as shown in Figure 1.8. For further demonstrations of data analysis, three new variables are created in the spreadsheet: (i) t as the time variable having values from 1 up to 180, (ii) Year having values from 1952 up to 1996 and (iii) Q as a quarterly variable having values 1, 2, 3 and 4 for each year (see the spreadsheet below).
Figure 1.6 The EViews example files in My Documents
c01_figure006
Figure 1.7 List of data that are available in EViews 4
c01_figure007
(4) Block Demo.xls and then click Edit/Copy
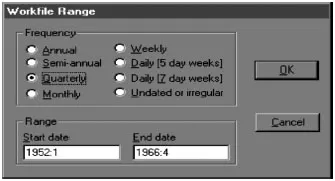
(5) Open Eviews and then click File/New/Workfile… This gives the window in Figure 1.9, showing the quarterly data set with starting and ending dates inDemo.xls.
The rules for describing the dates are as follows:
  • Annual: specify the year. Years from 1930 to 2029 may be identified using either 2- or 4-digit identifiers (e.g. ‘32’ or ‘1932’). All other years must be identified with full year identifiers.
  • Quarterly: the year followed by a colon or the letter ‘Q,’ and then the quarter number. Examples: ‘1932: 3,’ ‘32: 3’ and ‘2003Q4.’
Figure 1.8 A part of data in Demo.xls
c01_figure008
Figure 1.9 The workfile frequency and range
c01_figure009
  • Monthly: the year followed by a colon or the letter ‘M,’ and then the month number. Examples: ‘1932M9’ and ‘1939: 11.’
  • Semiannual: the year followed a colon of the letter ‘S,’ and then either ‘1’ or ‘2’ to denote the period. Examples: ‘1932: 2’ and ‘1932S2.’
  • Weekly and daily: by default, these dates should be specified as month number, followed by a colon, then followed by the day number, then followed by a colon, followed by the year. For example, entering ‘4: 13: 60’ indicates that the workfile begins on April 13, 1960.
  • Alternatively, for quarterly, monthly, weekly and daily data, just the year can be entered and EViews will automatically specify the first and the last observation.
  • For...

Índice