Marketing Analytics
Statistical Tools for Marketing and Consumer Behavior Using SPSS
José Marcos Carvalho de Mesquita, Erik Kostelijk
- 200 páginas
- English
- ePUB (apto para móviles)
- Disponible en iOS y Android
Marketing Analytics
Statistical Tools for Marketing and Consumer Behavior Using SPSS
José Marcos Carvalho de Mesquita, Erik Kostelijk
Información del libro
Marketing Analytics provides guidelines in the application of statistics using IBM SPSS Statistics Software (SPSS) for students and professionals using quantitative methods in marketing and consumer behavior. With simple language and a practical, screenshot-led approach, the book presents 11 multivariate techniques and the steps required to perform analysis.
Each chapter contains a brief description of the technique, followed by the possible marketing research applications. One of these applications is then used in detail to illustrate its applicability in a research context, including the needed SPSS commands and illustrations. Each chapter also includes practical exercises that require the readers to perform the technique and interpret the results, equipping students with the necessary skills to apply statistics by means of SPSS in marketing and consumer research. Finally, there is a list of articles employing the technique that can be used for further reading.
This textbook provides introductory material for advanced undergraduate and postgraduate students studying marketing and consumer analytics, teaching methods along with practical software-applied training using SPSS. Support material includes two real data sets to illustrate the techniques' applications and PowerPoint slides providing a step-by-step guide to the analysis and commented outcomes. Professionals are invited to use the book to select and use the appropriate analytics for their specific context.
Preguntas frecuentes
Información
1 Creating and examining databases in SPSS
1.1 Creating the SPSS spreadsheet and manipulating data

- Select “Variable View” sheet;
- Select the cells;
- Paste the list of questions.

- Select “Variable View” sheet;
- Select and double click the cell in the Value column;
- Fill in the dialog box, for example, value 1, label male, add;
- Repeat the steps for the other values;
- Click “OK.”

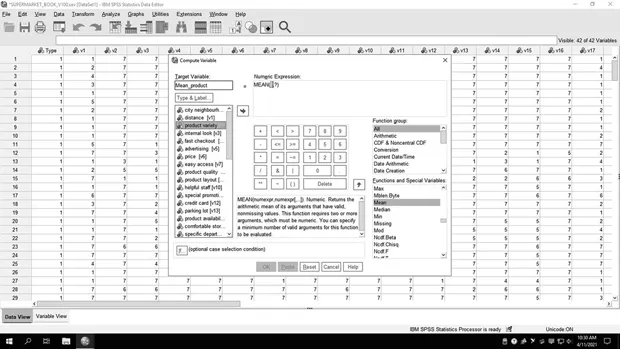
- Select “Transform”;
- Select “Compute Variable”;
- Enter name of the target variable (Example: Mean_Product);
- Choose the function (Example: MEAN);
- Select variables from which you want to calculate the mean (Example: v2, v8, v9, v14);
- Click “OK.”

- Select “Transform”;
- Select “Recode into different variables”;
- Select input variable (Example: repurchase intention (v35));
- Choose output variable name (Example: repurchase_group);
- Click “Change”;
- Click “Old and New Values …”;
- Select the values or the range (Example: Range 1 through 2);
- Create new value (Example: Value: 1);
- Repeat to include all values. In this example, you will get value 1 (low), value 2 (middle) and value 3 (high);
- Click “Continue”;
- Click “OK.”


1.2 Descriptive statistics with frequencies
- Analyze;
- Descriptive statistics;
- Frequencies;
- Select variable(s);
- Click OK.
Readers workshop
- Open the supermarket database;
- Perform the analysis, following the steps given above;
- Analyze the frequency;
- Analyze the descriptive statistics.
