Marketing Analytics
eBook - ePub

Marketing Analytics

Statistical Tools for Marketing and Consumer Behavior Using SPSS

José Marcos Carvalho de Mesquita, Erik Kostelijk

  1. 200 pagine
  2. English
  3. ePUB (disponibile sull'app)
  4. Disponibile su iOS e Android
eBook - ePub

Marketing Analytics

Statistical Tools for Marketing and Consumer Behavior Using SPSS

José Marcos Carvalho de Mesquita, Erik Kostelijk

Dettagli del libro
Anteprima del libro
Indice dei contenuti
Citazioni

Informazioni sul libro

Marketing Analytics provides guidelines in the application of statistics using IBM SPSS Statistics Software (SPSS) for students and professionals using quantitative methods in marketing and consumer behavior. With simple language and a practical, screenshot-led approach, the book presents 11 multivariate techniques and the steps required to perform analysis.

Each chapter contains a brief description of the technique, followed by the possible marketing research applications. One of these applications is then used in detail to illustrate its applicability in a research context, including the needed SPSS commands and illustrations. Each chapter also includes practical exercises that require the readers to perform the technique and interpret the results, equipping students with the necessary skills to apply statistics by means of SPSS in marketing and consumer research. Finally, there is a list of articles employing the technique that can be used for further reading.

This textbook provides introductory material for advanced undergraduate and postgraduate students studying marketing and consumer analytics, teaching methods along with practical software-applied training using SPSS. Support material includes two real data sets to illustrate the techniques' applications and PowerPoint slides providing a step-by-step guide to the analysis and commented outcomes. Professionals are invited to use the book to select and use the appropriate analytics for their specific context.

Domande frequenti

Come faccio ad annullare l'abbonamento?
È semplicissimo: basta accedere alla sezione Account nelle Impostazioni e cliccare su "Annulla abbonamento". Dopo la cancellazione, l'abbonamento rimarrà attivo per il periodo rimanente già pagato. Per maggiori informazioni, clicca qui
È possibile scaricare libri? Se sì, come?
Al momento è possibile scaricare tramite l'app tutti i nostri libri ePub mobile-friendly. Anche la maggior parte dei nostri PDF è scaricabile e stiamo lavorando per rendere disponibile quanto prima il download di tutti gli altri file. Per maggiori informazioni, clicca qui
Che differenza c'è tra i piani?
Entrambi i piani ti danno accesso illimitato alla libreria e a tutte le funzionalità di Perlego. Le uniche differenze sono il prezzo e il periodo di abbonamento: con il piano annuale risparmierai circa il 30% rispetto a 12 rate con quello mensile.
Cos'è Perlego?
Perlego è un servizio di abbonamento a testi accademici, che ti permette di accedere a un'intera libreria online a un prezzo inferiore rispetto a quello che pagheresti per acquistare un singolo libro al mese. Con oltre 1 milione di testi suddivisi in più di 1.000 categorie, troverai sicuramente ciò che fa per te! Per maggiori informazioni, clicca qui.
Perlego supporta la sintesi vocale?
Cerca l'icona Sintesi vocale nel prossimo libro che leggerai per verificare se è possibile riprodurre l'audio. Questo strumento permette di leggere il testo a voce alta, evidenziandolo man mano che la lettura procede. Puoi aumentare o diminuire la velocità della sintesi vocale, oppure sospendere la riproduzione. Per maggiori informazioni, clicca qui.
Marketing Analytics è disponibile online in formato PDF/ePub?
Sì, puoi accedere a Marketing Analytics di José Marcos Carvalho de Mesquita, Erik Kostelijk in formato PDF e/o ePub, così come ad altri libri molto apprezzati nelle sezioni relative a Business e Ricerche di marketing. Scopri oltre 1 milione di libri disponibili nel nostro catalogo.

Informazioni

Editore
Routledge
Anno
2021
ISBN
9781000481747
Edizione
1
Argomento
Business

1 Creating and examining databases in SPSS

DOI: 10.4324/9781003196617-1
IBM SPSS Statistics Software (SPSS) is statistical software widely used in social science studies. SPSS is short for Statistical Package for the Social Sciences. Section 1.1 gives an introduction on how to create an SPSS spreadsheet and how to manipulate data. Section 1.2 illustrates the use of frequency tables, and Section 1.3 provides more background on cross tabulations.
In this chapter, as in all the other chapters of this book, you have the opportunity to exercise with the SPSS spreadsheets. For these exercises, we refer to the SPSS files on the e-resources on the publisher’s website. The link to these e-resources at the time of printing this book is: www.routledge.com/9781032052199. Here you can find a link that says “Support Material,” and the resources will be available to download there. The link is also provided on the book’s cover.

1.1 Creating the SPSS spreadsheet and manipulating data

To create a spreadsheet in SPSS, we can input data manually or import from other spreadsheets, such as Excel, or use copy and paste tools. SPSS has only two sheets, Data View and Variable View. Data View contains the data itself, and the Variable View contains the names and variables specifications.
Figure 1.1 Data View sheet.
It is possible to input the variables labels, such as the questions, and the scale values, for example: 1 strongly disagree … 7 strongly disagree. There is also information about missing values.
To input the questions, follow the steps:
  1. Select “Variable View” sheet;
  2. Select the cells;
  3. Paste the list of questions.
Figure 1.2 Variable View sheet.
To add variables labels, follow the steps:
  1. Select “Variable View” sheet;
  2. Select and double click the cell in the Value column;
  3. Fill in the dialog box, for example, value 1, label male, add;
  4. Repeat the steps for the other values;
  5. Click “OK.”
Figure 1.3 Adding value labels.
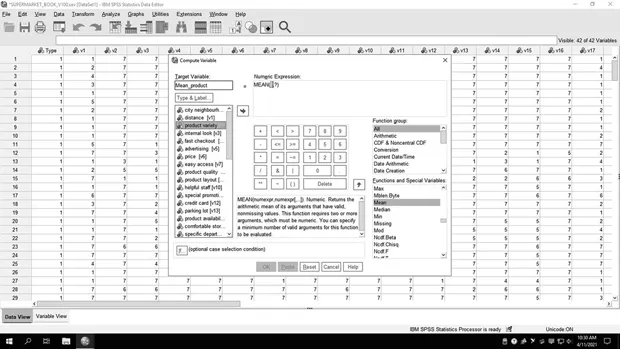
If we need to transform any variable, the program allows many options. The following figures show the steps. We use the SPSS file “Supermarket,” which you can find in the online material for this book (see publisher’s website). For example, to calculate the average (summated scale), do the following:
  1. Select “Transform”;
  2. Select “Compute Variable”;
  3. Enter name of the target variable (Example: Mean_Product);
  4. Choose the function (Example: MEAN);
  5. Select variables from which you want to calculate the mean (Example: v2, v8, v9, v14);
  6. Click “OK.”
Figure 1.4 Compute variable, I.
Figure 1.5 Compute variable, II.
To transform an interval scale in a nominal scale (for example, from 1 to 7 into three categories, low, middle, and high):
  1. Select “Transform”;
  2. Select “Recode into different variables”;
  3. Select input variable (Example: repurchase intention (v35));
  4. Choose output variable name (Example: repurchase_group);
  5. Click “Change”;
  6. Click “Old and New Values …”;
  7. Select the values or the range (Example: Range 1 through 2);
  8. Create new value (Example: Value: 1);
  9. Repeat to include all values. In this example, you will get value 1 (low), value 2 (middle) and value 3 (high);
  10. Click “Continue”;
  11. Click “OK.”
Figure 1.6 Recode into different variable, I.
Figure 1.7 Recode into different variable, II.
Figure 1.8 Recode into different variable, III.
The newly created values will appear at the end of your SPSS variable and data sheet, like this:
Figure 1.9 Recode into different variable, new variable added.

1.2 Descriptive statistics with frequencies

The frequency of a particular data value is the number of times the data value occurs. For example, if, on a Likert scale ranging from 1 (strongly disagree) to 5 (strongly agree), 12 respondents chose value 1, then the frequency of value 1 is 12. The frequency of a data value is often represented by f.
A frequency table is constructed by arranging collected data values in ascending order of magnitude with their corresponding frequencies.
We will use the supermarket database to illustrate this. Let’s consider the importance customers give to the variable price when choosing a store. This variable is measured on a seven-point interval scale, ranging from (1) not at all important to (7) very important. The respondents are split in three groups according to the average income of the neighborhood where they live in, (1) high, (2) middle, and (3) low.
To evaluate the frequency in SPSS, follow the steps:
  1. Analyze;
  2. Descriptive statistics;
  3. Frequencies;
  4. Select variable(s);
  5. Click OK.

Readers workshop

  1. Open the supermarket database;
  2. Perform the analysis, following the steps given above;
  3. Analyze the frequency;
  4. Analyze the descriptive statistics.
Figure 1.10 Descriptive Statistics – Frequencies, I...

Indice dei contenuti