Chemistry
Interpretation of Mass Spectra
Interpretation of mass spectra involves analyzing the patterns of ion fragmentation to determine the molecular structure of a compound. This process includes identifying the molecular ion peak, analyzing the fragmentation pattern, and using mass spectrometry databases to match the observed mass spectrum with known compounds. Interpretation of mass spectra is a crucial tool for identifying unknown compounds and elucidating their structures.
Written by Perlego with AI-assistance
Related key terms
1 of 5
9 Key excerpts on "Interpretation of Mass Spectra"
 eBook - PDF
- Stephane Bouchonnet(Author)
- 2013(Publication Date)
- CRC Press(Publisher)
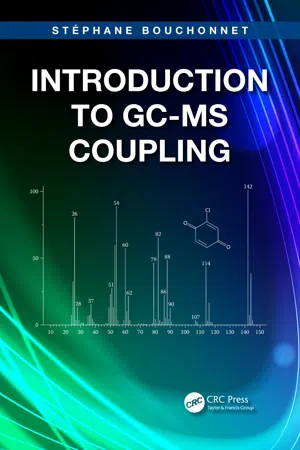
151 9 Introduction to Mass Spectra Interpretation 9.1 INTRODUCTION The interpretation of a mass spectrum cannot be improvised: experience shows that chemists who are not properly trained in mass spectrometry are often embarrassed when they start tackling the Interpretation of Mass Spectra. This is because the chem-istry of ions in the gaseous phase is often different from the chemistry of the same ions in solution. Most chemists learned to deal with solutions using techniques such as pH metrics, titration, and synthesis. Furthermore, except for photochemistry, clas-sical training treats species with even numbers of electrons: molecules and MH + or [M-H] – ions, respectively, emitted from protonated or deprotonated molecules. Electron ionization—by far the most used ionization mode in GC-MS—produces radical ions with odd numbers of electrons whose reactivities are very different from those of ions with even numbers of electrons. Consequently, some training is required to interpret mass spectra correctly. A book by this author (in French) dedicated to the Interpretation of Mass Spectra in GC-MS supplies many exercises and solutions. Practice is indispensable for mas-tering spectra interpretation. 1 This chapter is composed of three parts. The first covers principles of thermo-chemistry that are fundamental to the comprehension of the mechanisms involved in spectral interpretation: electronegativity, chemical bonds, acidity and basicity, inductive and mesomeric effects, the Audier-Stevenson rule, and stability rules for radicals in the gas phase. The second part of this chapter discusses the formation and fragmentation of ions according to the ionization modes used in GC-MS coupling: electron ionization and positive and negative chemical ionization. The dissociation mechanisms of ions (sim-ple cleavages, rearrangements, and secondary fragmentation) are described in detail. The final section suggests a strategy for the Interpretation of Mass Spectra. No longer available |Learn more
- (Author)
- 2014(Publication Date)
- Research World(Publisher)
Adequate definition of the experimental goal is a prerequisite for collecting the proper data and successfully interpreting it. Among the determinations that can be achieved with mass spectrometry are molecular mass, molecular structure, and sample purity. Each of these questions requires a different experimental procedure. Simply asking for a mass spec will most likely not answer the real question at hand. Interpretation of Mass Spectra Since the precise structure or peptide sequence of a molecule is deciphered through the set of fragment masses, the Interpretation of Mass Spectra requires combined use of various techniques. Usually the first strategy for identifying an unknown compound is to compare its experimental mass spectrum against a library of mass spectra. If the search comes up empty, then manual interpretation or software assisted Interpretation of Mass Spectra are performed. Computer simulation of ionization and fragmentation processes occurring in mass spectrometer is the primary tool for assigning structure or peptide sequence to a molecule. An a priori structural information is fragmented in silico and the resulting pattern is compared with observed spectrum. Such simulation is often supported by a fragmentation library that contains published patterns of known decomposition reactions. Software taking advantage of this idea has been developed for both small molecules and proteins. Another way of interpreting mass spectra involves spectra with accurate mass. A mass-to-charge ratio value ( m/z ) with only integer precision can represent an immense number of theoretically possible ion structures. More precise mass figures significantly reduce the number of candidate molecular formulas, albeit each can still represent large number of structurally diverse compounds. A computer algorithm called formula generator calcu-lates all molecular formulas that theoretically fit a given mass with specified tolerance. eBook - PDF
- Satinder Ahuja, Neil Jespersen(Authors)
- 2006(Publication Date)
- Elsevier Science(Publisher)
The mass spectrometer converts neutral molecules into charged particles (either positive or negative ions) and sorts them according to their respective mass-to-charge ( m/z ) ratios. A graphical presentation of the relative abundances of the various ionic species, as a function of their m/z value, is a mass spectrum. The appearance of a mass Comprehensive Analytical Chemistry 47 S. Ahuja and N. Jespersen (Eds) Volume 47 ISSN: 0166-526X DOI: 10.1016/S0166-526X(06)47011-2 r 2006 Elsevier B.V. All rights reserved. 319 spectrum, both in terms of which ionic species are observed, as well as their abundances, serves as the basis for compound identification. The information derived from a mass spectrum is often combined with that from other analytical techniques, such as infrared spectroscopy and nuclear magnetic resonance spectroscopy, to generate structural assign-ments for organic molecules. The attributes of mass spectrometry that make it a versatile and valuable analytical technique are its sensitivity (e.g., recently, a detection limit of approximately 500 molecules, or 800 yoctomoles ¼ 800 10 24 mol has been reported) and specificity in detecting or identifying unknown compounds. The sensitivity of the technique is attributable to the filtering action of the analyzers with the associated elimination of background interferences, and the significant signal amplification (on the order of six orders of magnitude) achievable with modern electron multiplier detectors. Specificity is a product of both the molecular mass information carried by the parent ion (i.e., the ionized neutral analyte molecule) and the aspects of molecular structure that can be inferred from the reproducible and characteristic fragmen-tation processes.
- SachchidaNand Shukla(Author)
- 2019(Publication Date)
- Arcler Press(Publisher)
Mass Spectrometry 2 CONTENTS 2.1. Introduction ..................................................................................... 40 2.2. The Theory Of Mass Spectrometry .................................................... 42 2.3. Main Terminologies Used In Mass Spectrometry .............................. 48 2.4. Ionization Techniques In Mass Spectrometry ..................................... 55 References ............................................................................................... 62 Introduction to Modern Instrumentation Methods and Techniques 40 2.1. INTRODUCTION Mass spectrometry is a type of micro-analytical practice, which can be employed for detecting and determining the quantity of any given analyte. We also use Mass spectrometry for determining the elemental composition and few characteristics of the molecular structure of a given analyte. We accomplish these tasks by the experimentally measuring the mass of gas-phase ions that are created from molecules of an analyte (Dalton, 1808; Duckworth & Nier, 1988). Some distinct characteristics of mass spectrometry are its capability of directly determining the minimal mass (and in few cases, the molar mass) of any given analyte, as well as its capacity to both produce and identify fragments of the molecule corresponding to distinct groups of atoms of various different elements which reveal structural characteristics. Furthermore, mass spectrometry has the ability to produce more structural info per unit quantity of any given analyte that can be determined by using any other type of analytical method (Berzelius & Schönbein, 1900; Anders, 2009). Mass spectrometry is mostly concerned with the mass of the isotopes of the elements, and hence not with the atomic mass of the elements (Santavy, 1967; Roboz, 1968). The weighted average of the naturally happening stable isotopes comprising the element is known as the atomic mass of an element.
- Wilfried M. A. Niessen, Ricardo A. Correa C.(Authors)
- 2017(Publication Date)
- Wiley(Publisher)
Bioanal Rev 2: 23–60. Kumar K, Menon AG, Sastry PS. 1992. Computer-assisted determination of elemental composition of fragments in mass spectra. Rapid Commun Mass Spectrom 6: 585–591. 70 Interpretation of Mass Spectra Li L, Kresh JS, Karabacak NM, Cobb JS, Agar JN, Hong P. 2008. A hierarchical algorithm for calculating the isotopic fine structures of molecules. J Am Soc Mass Spectrom 19: 1867–1874. Li L, Karabacak NM, Cobb JS, Hong P, Agar JN. 2010. Memory-efficient calculation of the isotopic mass states of a molecule. Rapid Commun Mass Spectrom 24: 2689–2696. Lin ZJ, Li W, Dai G. 2007. Application of LC–MS for quantitative analysis and metabolite identification of therapeutic oligonu- cleotides. J Pharm Biomed Anal 44: 330–341. Loo JA, Loo RR, Light KJ, Edmonds CG, Smith RD. 1992. Multiply charged negative ions by electrospray ionization of polypeptides and proteins. Anal Chem 64: 81–88. McLafferty FW, Tureˇ cek F. 1993. Interpretation of Mass Spectra. 4th ed. University Science Books, Mill Valley, CA. ISBN 978-0-935-70225-5. Mann M, Meng CK, Fenn JB. 1989. Interpreting mass spectra of multiply charged ions. Anal Chem 61: 1702–1708. Mohr JP, Newell DB, Taylor BN. 2015. CODATA recommended values of the fundamental physical constants: 2014. National Institute of Standards and Technology. http://arxiv.org/pdf/1507 .07956. Moriwaka T, Newbold BT. 2003. Analogous odd-even parities in mathematics and chemistry. Chemistry 12: 445–450. Muenster H, Taylor L. 2009. Mass resolution and resolving power. Thermo Fisher Scientific publication XX30175_E 02/09C. Murray KK, Boyd RK, Eberlin MN, Langley GJ, Li L, Naito Y. 2013. Definitions of terms relating to mass spectrometry (IU- PAC Recommendations 2013). Pure Appl Chem 85, 1515–1609. Nakabayashi R, Sawada Y, Yamada Y, Suzuki M, Hirai MY, Sakurai T, Saito K.
- Theodore Kuwana(Author)
- 2012(Publication Date)
- Academic Press(Publisher)
Except for simple pattern matching, most applications will involve some degree of interpretation. The first step in interpreting a mass spectrum is usually the identification of the molecular ion peak, or the recognition of its absence. The second step usually is the definition of the fragmentation pattern. A large and active literature exists in which correlations are reported of fragmentation patterns with structures of known compounds. Most sophisticated laboratories employ stable isotope labels, accurate mass measurements, and metastable ions to define fragmentation patterns and also mechanisms of decomposition pro-cesses. In general, specific fragmentation patterns have been found to be characteristic of given structural elements, and especially of functional groups. Among the most simple of these is the loss of water usually observed Applications of Mass Spectrometry 111 in the spectrum of compounds that contain aliphatic hydroxyl groups. Fragmentation patterns are often altered when several structural elements or functional groups are combined in a molecule, and one usually has to evaluate each family of compounds anew. Once the fragmentation patterns and characteristic ions have been dis-cerned in a spectrum, the delicate process begins of moving on to the structure of the sample. Several approaches have been described in the literature (Biemann, 1962; Budzikiewicz et a/., 1967; McLafferty, 1973). While these approaches share many features in common, that developed by Djerassi and co-workers may be termed mechanistic, and that of McLafferty arith-metic (Budzikiewicz et al, 1967). In defining the shift technique, Biemann (1962) early recognized that most samples are already known to be members of a given structural family and that it is of great value to compare spectra of related compounds from this family. eBook - PDF
- Rose Marie O. Mendoza(Author)
- 2019(Publication Date)
- Arcler Press(Publisher)
The first analytical uses then followed in the early’40s when the first trustworthy commercial mass spectrometer was produced. This was primarily for the quantitative determination of various components in the complex mixtures of the crude oil. In the start of 60’s the application of the mass spectrometry to identification and structure explanation of the more intricate organic compounds, including the biomolecules and polymers, started. Since then the mass spectrometry has developed to the versatile and powerful tool for this objective, which provides the information part corresponding to and coinciding with the other techniques like NMR. It is quite surprising that the technique which at first sight doesn’t appear to provide more information than the weight of the particle should be important, as it is very difficult to imagine the more prosaic property of the molecule as compared to its molecular weight. The controlled disintegration of initial molecular ions produces interesting information which can contribute to the structure elucidation. Additionally, the weights can be determined with adequate accuracy to allow the elemental configurations to be derived (Goodacre et al., 2007; Bauer et al., 2011). 6.2. FUNDAMENTAL CHARACTERISTICS OF THE MASS SPECTROSCOPY To understand what the mass spectroscopy instrument is doing, imagine of the “parallel scale.” This is the bathroom scale which one can step on with the twist: Rather than weighing the single person, the weights of various people can be measured in parallel. Imagine the giant scale, where around a million people in parallel can step on. The parallel scale tells us that 5 Introduction to Mass Spectrometry 171 thousand people weighted around 64.7 kg and 12 thousand people weighted around 77.3 kg (Figure 6.1). Figure 6.1: Schematic illustration of the mass spectrometry process.
- Kenneth Williamson, Katherine Masters(Authors)
- 2016(Publication Date)
- Cengage Learning EMEA(Publisher)
261 Although its origins date back to the early part of the 20th century, mass spec-trometry (MS) has experienced a renaissance in the past two decades due to major improvements in ion formation and analysis. Because MS is capable of providing composition and structure information for a broad range of com-pounds at sensitivities much greater than those of other techniques, more money is invested worldwide in mass spectrometers than in any other type of instrumentation. In the chemical and life sciences, MS is used to identify and quantify com-pounds present in complex organic mixtures; to identify structures of biomol-ecules such as carbohydrates, nucleic acids, and steroids; to sequence proteins and oligosaccharides; to determine how drugs are used by the body; and to check fermentation processes for the biotechnology industry. In environmental science, MS is used to detect environmental pollutants such as dioxins and mercury in fish and humans and to determine gene damage from environmental causes. In forensic science, MS is used to confirm and quantify drugs of abuse and steroid use by athletes and to identify accelerants used in arson. MS is used to determine the age and origins of specimens in geochemistry and archaeology; to locate oil deposits by measuring petroleum precursors in rock; to report the composition of molecular species found in space; to perform ultrasensitive, multielement in-organic analyses; and to establish the elemental composition of semiconductor materials. MS changes at a fast pace, primarily in the discovery of new methods for introducing ionized molecules in the gas phase into the spectrometer. Not many years ago, the idea of analyzing proteins by MS would have been thought impossible. Notice that the infrared (IR), nuclear magnetic resonance (NMR), and ultraviolet (UV) methods are called spectroscopy, but MS is mass spectrometry. eBook - PDF
Flavour '81
3rd Weurman Symposium Proceedings of the International Conference, Munich April 28–30, 1981
- Peter Schreier(Author)
- 2019(Publication Date)
- De Gruyter(Publisher)
THE HORIZONS OF IDENTIFICATION AND ANALYSIS WITH MASS SPEC-TROMETRY Ir M.C. ten ricever de Braaw Division for Nutrition and Food Researcn TNO Institute CIVO-Analysis Utrecntseweg 48, 3704 HE Zeist, Tne Netneriands Introduction In tne last decade the application of mass spectrometry has increased enormously especially in the fields dealing with tne detection and identification of small amounts of organic compounds in complex mixtures. Mass spectrometry has a colourful and rich nistory wnicn goes back to the beginning of the century. Tne first mass spectrometers were designed oy J.J. Tnomson (i) in 1910 and 1918 oy F.tf. Aston (2) and A.J. Dempster (3). Mass spectrometers were first used only Dy physicists, sep-arating chemical elements into their isotopes (4) and per-forming exact determination of atomic weignts. it tooK another twenty years before the mass spectrometers fell into tne nands of chemists. Tne first commercial instruments be-came an important tool to cnaracterise complex crude oil mixtures. Another twenty years later mass spectrometry De-came of great interest to applications in organic chemistry. The principle of a mass spectrometer is based on the fact that charged particles (ions) accelerated to a certain kin-etic energy oy an electric field, descrioe in a suosequent magnetic field paths that differ according to their mass to cnarge ratio. © 1981 by W a l t e r d e G r u y t e r &. C o , Berlin • N e w Y o r k Flavour '81 254 Nowadays mass spectrometers exist with mass analysers other than tne magnetic type, such as quadrupoles (51), time of flignt (6) and ion cyclotron resonance mass spectrometers (7) . In tne ion source of a mass spectrometer tne organic molecules are ooiriDarded in vacuum by energy-controlled elec-trons emitted from a heated filament. In the ionisation pro-cess not only molecular ions are formed but also a large number of different fragments.
Index pages curate the most relevant extracts from our library of academic textbooks. They’ve been created using an in-house natural language model (NLM), each adding context and meaning to key research topics.